
This article is written by Kourosh Karimkhany, Head of Publisher Development at Tugboat Yards, a Sovrn publishing partner.
If you have a blog with a sizable audience (about 100,000 unique visitors per month, or so), you likely have a sizable group of true fans — people who come to your site more than 30 times a month. These are the folks who really like your site — picture screaming teens chasing after The Beatles. And these are the folks you should seek to connect with and coddle.
Let’s illustrate why these true fans are so important. We at Tugboat Yards have looked at the Google Analytics of dozens of sites, and we’ve discovered something fascinating.
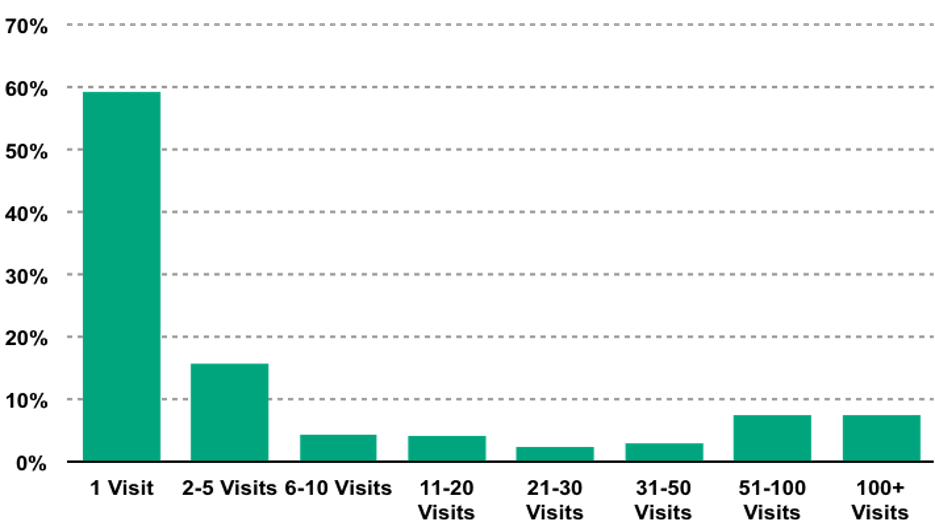
The chart above illustrates the average distribution of traffic across 13 large and fairly well-known sites. Take a look at the big bar on the left. We found that about 60% of readers come to the sites just once and never came back. Think about that for a minute. A huge portion of your readers don’t care about you or your site, sadly. So if Google Analytics tells you, you have 10 million monthly uniques, around 6 million of them are merely passersby.
Now look at the right side of the chart. This is where things get interesting. Notice how the columns start to get taller again after 30 visits per month. About 20% of visitors come back more than once daily, and around 10% of visitors come back more than 100 times a month! These are the true fans — the addicts, the people who idolize the editors, publishers and founders of the sites — and these are the visitors publishers should be bending backwards to know and please.
We’ll talk about how to please these folks in future posts. First, we’re going to tell you how to find them on your site.
If you have Google Analytics installed on your site, you can produce a chart like the one above for yourself. Here’s how you do it:
- Log into your Google Analytics account. You should see a screen similar to this:
1.png”>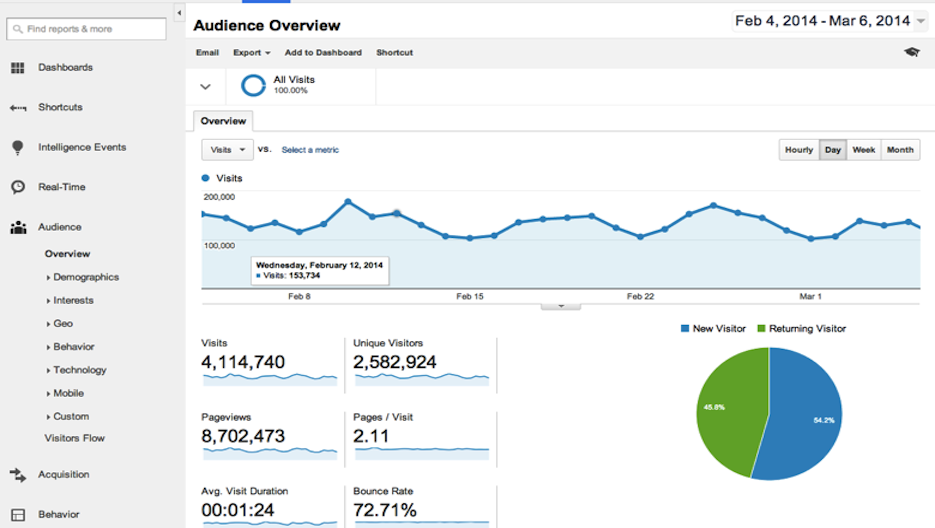
- Click “Customization” on the Google Analytics menu bar. Then click “New Custom Report.”
- In the “Title” field type “User Frequency.” Type the same thing in the “Name” field under “Report Content”. You can name the report anything else you like, of course.
- In the “Metrics Group” section click “Add Metric” and begin typing “Unique Visitors.” Select “Unique Visitors” in the drop-down menu.
- In the “Dimensions” drill-down section click “Add Dimension.” Begin typing “Count of Visits.” Select “Count of Visits” in the drop down menu.
- At the bottom of the page click “Save.”
- Google Analytics will generate a report that looks like this:
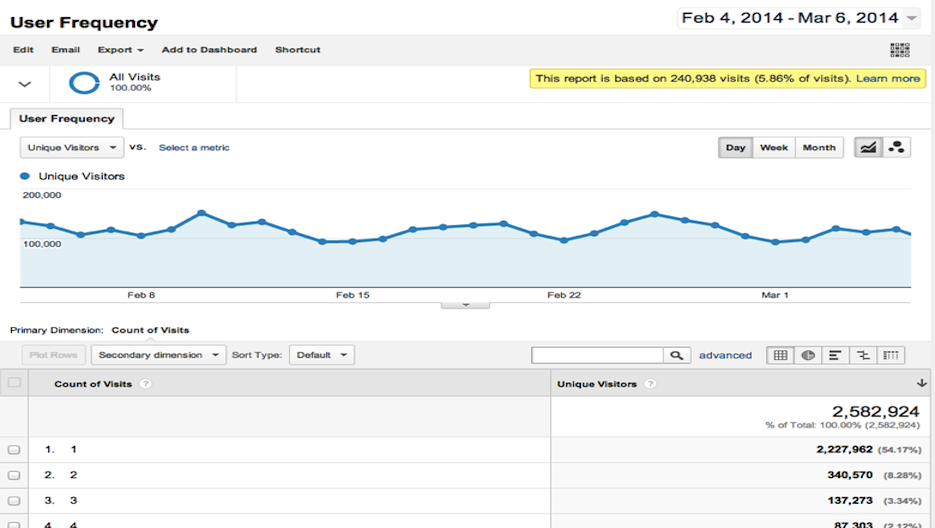
- At the bottom of that page in the “Show Rows” drop down menu select 1000. The table in the bottom portion of the report will lengthen significantly.
- Near the top of the page click the “Export” drop down menu and select “Excel (XLXS)” or “Google Spreadsheets” if you don’t have Excel. We chose Google.
- Open the file in Google Spreadsheet.
- The very last row in Column B has the number of total visitors to your site. Usually this is in row 1002, although if your site is relatively small the last row will be higher in the sheet.
- Now, in cell C2 write this formula: “=B2/$B$1002”. This calculates the percentage of visitors who visited your site exactly once. In our example the number is 54 percent.
- Copy the formula in C2 down to C1001.
- To summarize the data better, we created subtotals in our spreadsheet, summing the percentages of various groups — for example, visits 2-5, visits 6-10 and so on. You can choose different groups to sum.
- Use the charting function in your spreadsheet to generate column graphs. In our Google Spreadsheet, we selected cells G7 to H14 and clicked the “Insert chart” button.
We see from this report that a majority of the site’s visitors — 54% — came just once. There are several possible reasons for this. Most likely, many of these visitors came to the site through a search result — a hypothesis we confirmed by looking at the Acquisition Overview report in Google Analytics. (You can find this report by going back to the main screen and in the left sidebar choosing “Overview” under the “Acquisition” section.)
Another reason why users don’t stick around is likely because they saw a compelling headline in Twitter or Facebook, clicked to read the story and moved on. Again, this is confirmed by referral reports in Google Analytics.
For you, the publisher, this lack of loyalty might be discouraging. To be honest, we were shocked by the disloyalty ourselves. But as we looked at more and more sites we realized this is a normal pattern. Publishers aren’t doing anything wrong. It’s just the way things are.
The good news is most sites also have a sizable number of true fans (which we define as people who come back more than 20 times a month). For the site we used in our example, around 20% of the visitors qualify as true fans. We won’t name the site to preserve their sensitive data, but it’s a high-quality site, as proven by the hundreds of thousands of people who read it twice or more per day.
Through this exercise we’ve gained a new perspective on audience size. Several of us at Tugboat Yards have been publishers and editors of very large sites. As people who made their living relying on advertising, we realized we have focused perhaps too much on total unique visitors, but not enough on the number of true fans. We admit we’ve been obsessed with goosing one-time visits through SEO and social media tricks, but we didn’t cater to readers passionate about our narrative. Perhaps we would all be better off in the digital media industry by shifting our focus.
About Tugboat Yards
![]() Tugboat Yards helps digital publishers find their true fans, establish new revenue streams, and foster meaningful relationships with their supporters. On Tugboat Yards, publishers create custom offers — personalized experiences, ongoing subscriptions, digital goods, and physical items — to encourage support from their audience.
Tugboat Yards helps digital publishers find their true fans, establish new revenue streams, and foster meaningful relationships with their supporters. On Tugboat Yards, publishers create custom offers — personalized experiences, ongoing subscriptions, digital goods, and physical items — to encourage support from their audience.